How should you be filtering your data in Tableau?
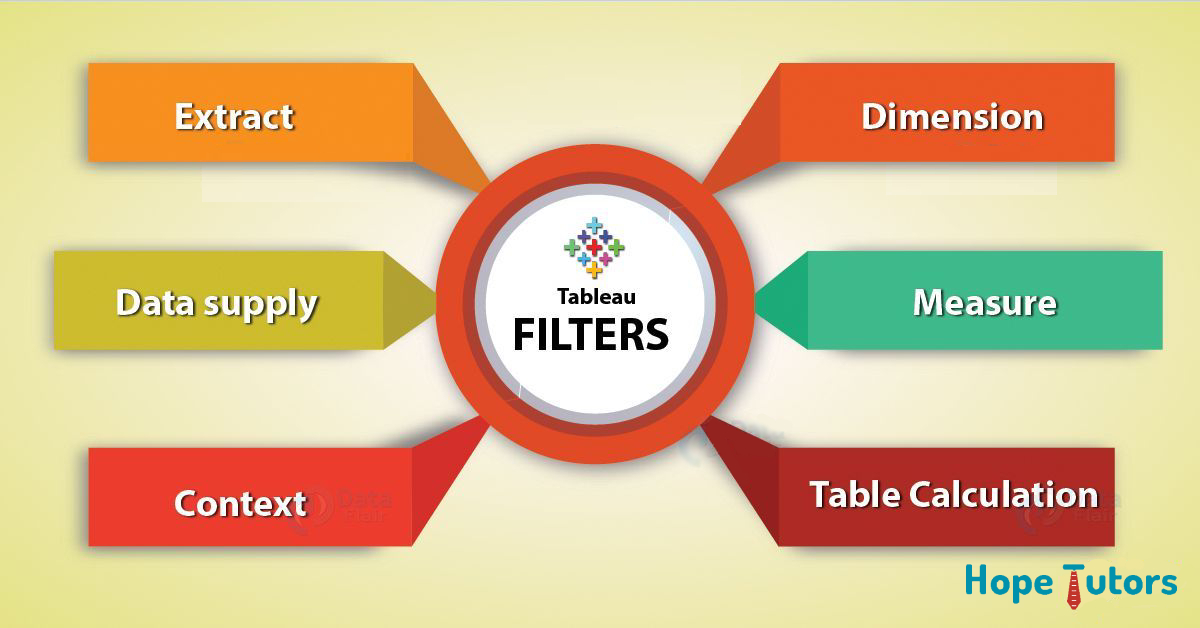
Data filtering:
Filtering is an easy way for restricting huge data for the analysis. Few amounts of data are used to analyze. Executing the query is very much faster. Different ways are available to filter the data in Tableau. First, we should create the filters on the data source. Then, we can implement after creating the extract. Then we can filter measures, dimensions as well as dates.
The context filter can act as an independent filter. We can create the context filter as well as other filters. All we need is dependent filters. They process these data only after they passes through context filter. We can show the filter in the view. So that, we can allow users to interact.
Filters are very flexible. The only thing is we should use very carefully. They are so expensive. Reducing total number of the filter can improvise the performance.
Important points to remember for data filtering:
(a) Data filtering in Data source:
Creating a filter in the data source can reduce the volume of the data. For the systems with heavy rely on partitions, we must use data source filters. The systems with indexing also should use data source filter. This may give a good control for the performances of the queries issued.
Keep Only the Filters are the beat when compared with Exclude Filter. Because the Exclude Filters loads all the data for the dimension. They run very slowly. So, we should prefer to use Keep Only Filter.
(b) Adding Filters:
Are we working with the huge amount of the data? Automatically updates will be turned off for these data. Then we can rashly create very slow queries when we add filter to the views. Building these views as well as specifying these filters, we should first specify this filter. Then we can drag the fields to view. When we turned on the automatic update first the filters will evaluate.
(c) Context Filters:
Context filter are an independent filter. We can set other filter to process the data only. The data are passes by the context filters. We can only use the context filter when limited the size of these data set. If we use filters which reduces data set size & more data views. Then we should set these filters as the context filter.
(d) Creating ‘set’ to the filter data:
We need to create a set than using a quantitative filter. This is to filter the dimensions to remove the members. Removing members will base on the range of measured values. Example: We can create the sets to return only 50 top items. Rather than retuning all the items in the dimensions.
Whenever creating the group from selection which are described in the GroupYourData. We should make sure that includes only columns of the interest. Every additional column in these sets will decrease the performance.
(e) Aggregating the data using the Custom SQL:
Another way for restricting the analyzing huge data is using custom SQL. This is an alternative way to filters. Suppose the reviews data which store in SQL Server tables. This data is use for the analysis. We have interest only in data from “rating” as well as “reviewer ID” field. To procreate the data to bring to Tableau only with the interested fields. Then we may use the below customs SQL.
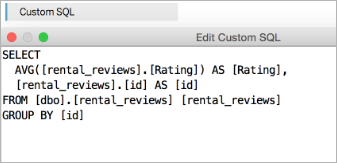
This customs SQL queries reduces the total amount of the data come into Tableau. It procreates the reviews & averages these values in review ratings.
How to Filter the cube data:
Following are few specific tips which apply for filtering the cube data.
(a) Filter on the specific dimensions:
If our cube has single huge dimension. We should set the filter directly to that dimensions. Rather than set these filters on the other dimensions / measures. For examples: We want to reduce number of the products displayed in view. We should set the filters directly on the Products / to create the computed set. A computed set may base on Products other than to filter another field. Other fields may be Location / Profit.
Also, we must avoid selecting the large number of the members from the large dimensions. When the dimensions are large then keep size of these filter less than thousand.
(b) Create the set:
Create the set from selections as described in Create Sets. We should make sure that including only the column of interest. Columns should include in Create the Set dialog boxes. Each extra column in this group will decrease the performance.
For examples: We create the set which contains all the regions including the sales 8,000 & 15,000. But we include the column that doesn’t affect these members of set. We may notice the decrease in the performances. To remove the extra columns, just right-click on the column. Then select the Remove This Column in context menu.
(c) Use Exclude commands:
If we are working in the dimension whose root levels are greater than thousand. But the values are less than one lake then avoid using these Filter dialog boxes. We can drag dimension to the shelf. Use Exclude commands in the header context menus. This limits the data displayed in view.
Steps to filter the data:
Following are the steps to filter the data.
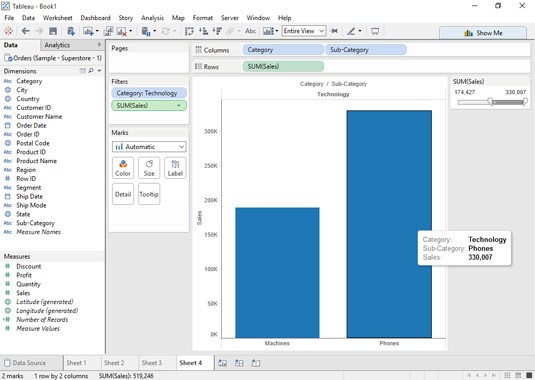
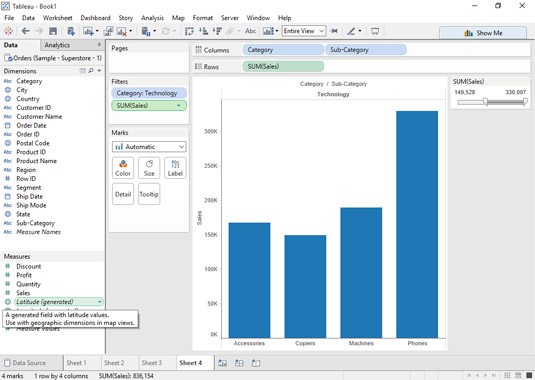
1. Drag and drop a field onto the Filters shelf. This will help to display the Filter dialog box.
• In this case we are using the Category dimension.
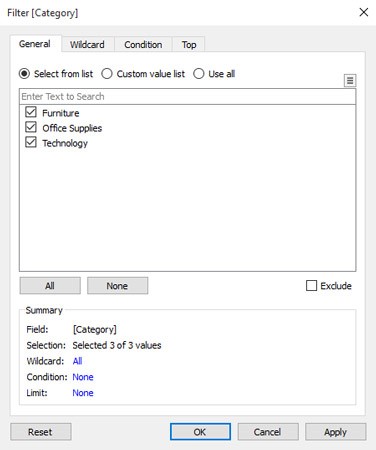
2. On the dialog box’s General tab, we should select the check boxes. This is for the data we want to include.
• Select the Technology check box. Leave the other check boxes deselected. The items in the Technology category will include.
3. Click OK to apply the filter.
• Filtering the results using a dimension enables we to select. We can select from distinct members of that dimension. Filtering using a measure works just a bit different. The measures are most commonly numeric values.
• To add a filter based on a measure. We should follow these steps.
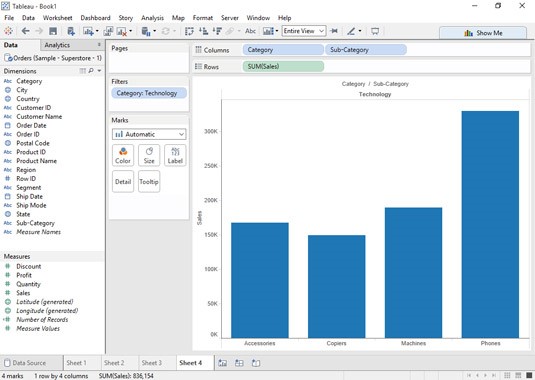
4. Drag a measure and drop it onto the Filters shelf. This will display the Filter Field dialog box.
• In this case we use the Sales field.
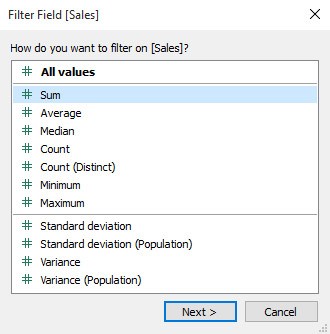
5. Select the type of operation we want to use from the list displayed.
• Choose Sum to enable us to select from the range of Sales values. This aggregated by sum in the view.
6. Click Next to display the Filter dialog box. The options displayed at the top of the dialog box. We should select the type of filter we want.
• In this case, choose the Range of Values option. We are flexible when we use the filter.
• Whatever option we choose, the dialog box refreshes to display. This will display controls specific to that option.
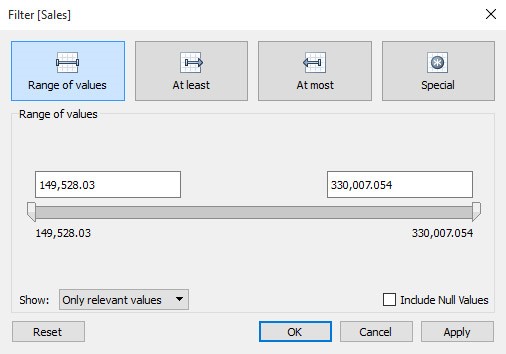
7. To specify the range of values now, use the sliders to set the range.
• In this case, leave the sliders as it is. Because we will add a slider to visualize as a quick filter.
8. Click OK to apply the filter.
• Return to the workspace.
9. Click the down arrow on the right side of the Sales field on the Filters shelf. This will display this menu.
• The visualization now has a sales value slider.
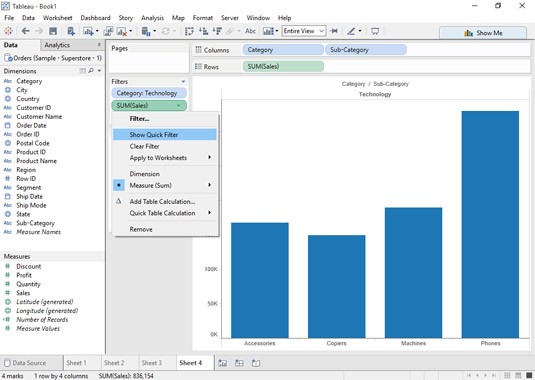
10. Select Show Quick Filter to return to the workspace. This will return with the Sales Value slider added.
• Use the slider to select the sales.
11. Drag the slider to control which sales appear in the visualization.
• When we drag the slider across the scale Tableau updates the view. The filter is set to show a range of values. We can use both the upper and lower sliders to restrict the range.
• The fields we add to the Filters shelf don’t have to appear in the visualization. For example: Using profit to filter the results of sales. The analyzed sales provide the option to only see profitable sales.